Embed Graph
Copy and paste: If you adjust the width and height parameters, the graph will scale to fit inside the box.Parameters
a -- Polynomial coefficients (an).-- A polynomial equation can be specified in the url by passing the coefficients (a) as a reversed, comma delimited sequence. For example: the equation:
y = x2 + 2 x - 3
Is referenced as:
graphs.html?a=-3,2,1
pts -- the coordinates of points on the graph.
-- A series of points can be entered as a comma separated list of x, y coordinates. For example, the points:
(3,7), (2,-3), and (5,1)
Can be plotted as:
graphs.html?pts=3,7,2,-3,5,1
show_input -- Show the input box to add lines and points to the graph.
none - Turn off the input boxes at the top of the graph:
polynomial - (default) Show the interface for polynomial equations.
points - Show the interface for adding points to the graph.
For example, the url for the above equation with no input box would be:
graphs.html?a=-3,2,1&show_input=none
fit -- Adjust the size of the graph in the iframe. Options:
auto - (default) scales so graph is slightly smaller than window so there are no scroll bars on the frame.
full - scales so graph is fully fits the smallest dimension of the iframe window.
none - creates 600x600 pixel graph in a window.
For example, the url for the above equation with no input box and full fit:
graphs.html?a=-3,2,1&show_input=0&fit=full
range -- The maximum range (positive and negative) for the axes.
-- The default range is 10 so the x and y axes minimums are -10 and the maximums are 10 (as shown above). By default, the tick marks are interpolated to be 10% of the range. To change the range to 20 use:
range=20
So, for example:
graphs.html?a=-3,2,1&range=20
dx -- The interval between tick marks on the axes
-- The default tick marks are interpolated to be 10% of the range if the width of the graph is greater than 300 pixels, and 20% if smaller (note that these do not exactly correspond to the values set for the iframe since, except for the fit=none option, some adjustment is made. To change the dx to 5 use:
dx=5
So, for example (with the range set to 20):
graphs.html?a=-3,2,1&range=20&dx=5
integrate -- Find the area under the curve within the given bounds.
-- Enter a comma delimited list of:
- a - the left bound (lower limit) of the area.
- b - the right bound (upper limit) of the area.
- n - the number of trapezoids used in the integration.
So, to find the integral (area under the curve) between x = 1 and x = 5 using 4 trapezoids use:
integrate=1,5,4
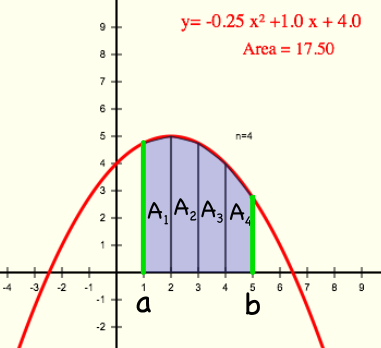
For an example, we'll find this integral for the curve f(x) = -0.25x2 + x + 4 :
graphs.html?a=4,1,-0.25&integrate=1,5,4
The area using 4 trapezoids is 17.5 as shown in this numerical integration example.
