Makerspace at the Fulton School
Graphing Polar Sine
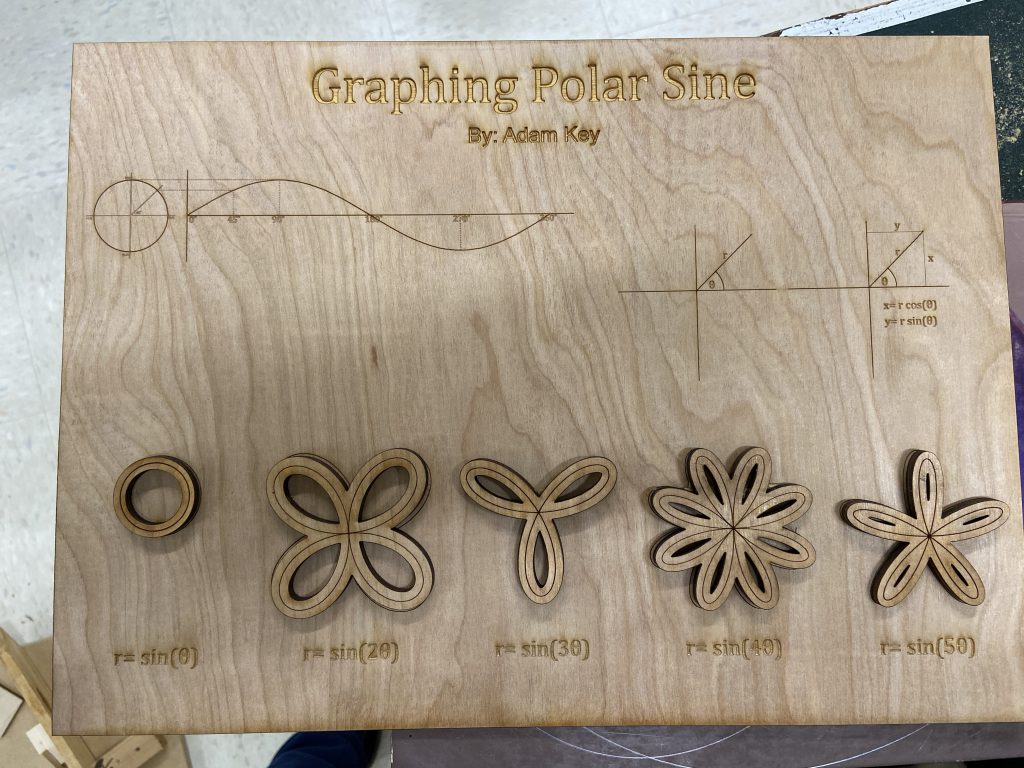
For my math project, I made a graphing polar sine interactive board. I made a function in Corel to make the shapes. You can change the frequency of sine in the program to get the shape you want. For all odd sine functions, the line will go around the shape twice. For all even sine functions, the line will go around the shape once. The code I used is shown below:
Sub polarsin()
'makes polar sine graphs
'by: Adam Key
'changes b changes the frequnce of the curve
Dim pi As Double
pi = 3.14
Dim angle As Double
Dim r As Double
Dim x, y As Double
Dim b As Double
b = 3
Dim crv As CurveSet crv = ActiveDocument.CreateCurveSet sp = crv.CreateSubPath(0, 0)For i = 0 To 360angle = i * pi / 180r = Sin(angle * b)x = r * Cos(angle)y = r * Sin(angle)sp.AppendLineSegment x, yNext iDim s As ShapeSet s = ActiveLayer.CreateCurve(crv)
End Sub
Recent Comments