I have made a production possibility curve for the makerspace 3D printers making face shields and face masks. The curve shows how many products you can make in 24 hours working as efficiently as possible.
The image above shows the raw data of how long each product takes to print and how much filament it takes to print it.
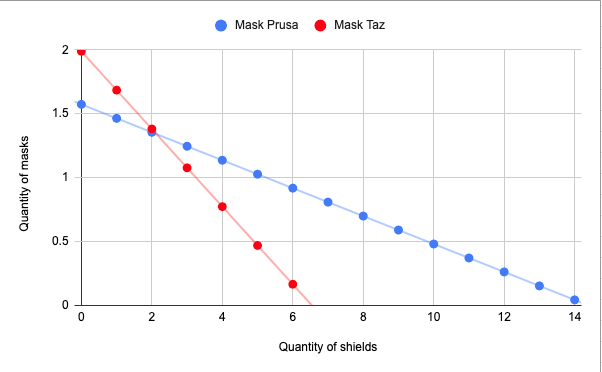
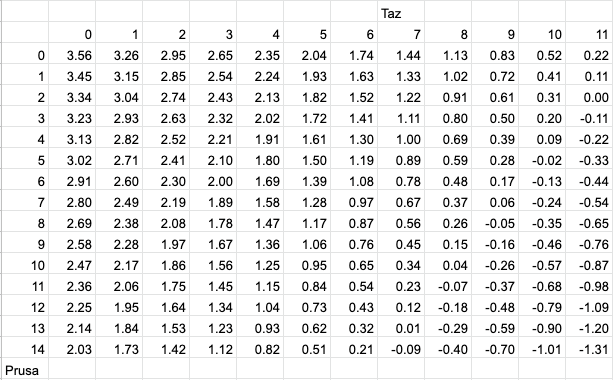
The graph above is the production possibility curve for the makerspace working at max capacity. The red line shows the production possibility using the Taz printer. The blue line shows the production possibility using the Prusa printer. Say you want to make 8 shields in the Prusa printer, you can look on the x-axis for 8 shields and then look at that on the blue line which then shows you how many masks you can make which is 0.75 masks.The table above shows the production possibility for making shields on both printers. The axis on the top that goes from 0-11 is the amount of shields you can make on the Taz printer. The left axis that goes from 0-14 is the number of shields you can make on the Prusa printer. Say you want to make 5 shields on the Taz and 7 shields on the Prusa you can make 1.28 masks.

Recent Comments